Dashboard
What this covers
The Dashboard is ECP's configuration health view. It summarises tenant stability and config accuracy for a selected period, backed by activity charts and the latest config events. It's the first page to open when you want to know whether configuration activity is stable and whether recent deployments are succeeding.
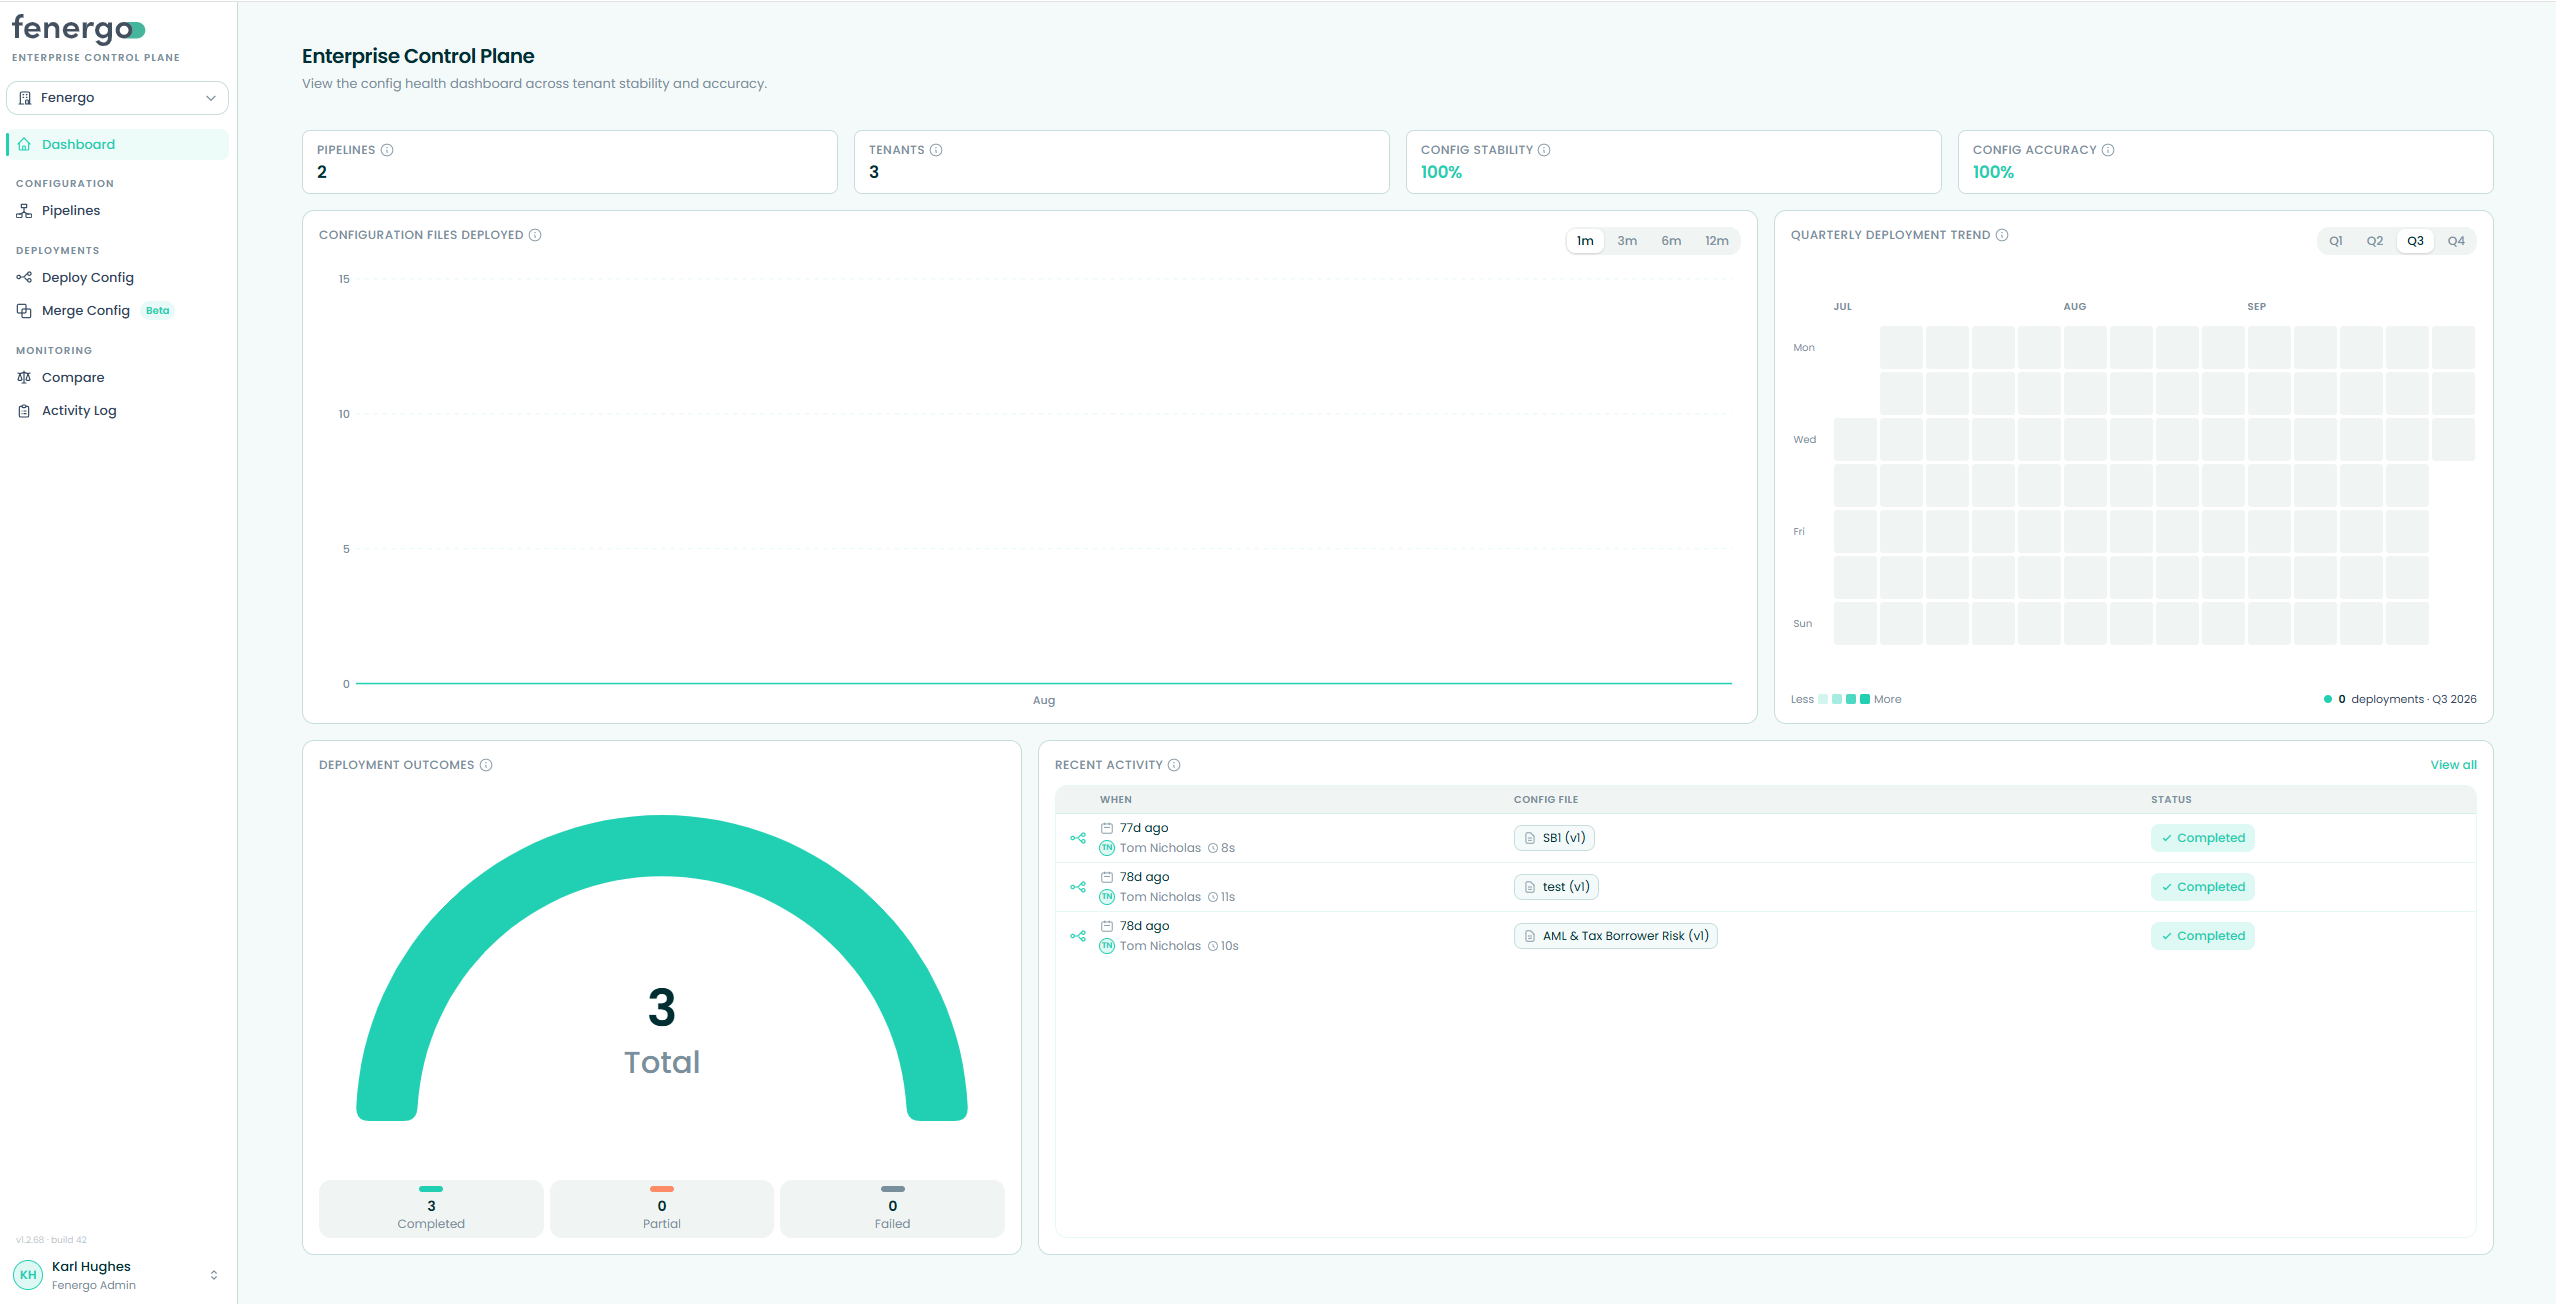
Reading the KPI cards
The top row shows four cards:
- Pipelines — the number of deployment pipelines you have access to.
- Tenants — the number of tenants connected across those pipelines.
- Config Stability — overall tenant stability for the selected range, as a percentage.
- Config Accuracy — success quality for configuration files processed during the period, as a percentage.
Hover the info icon on any card for a short description of what it measures. The Config Stability and Config Accuracy cards are colour-coded: teal for healthy, amber for moderate, and red for low.
Panels
The dashboard below the KPI strip is arranged in two rows of two panels:
- Configuration Files Deployed — a trend line and filled area showing how many files were deployed over the selected period. Use the 1 / 3 / 6 / 12 month selector to adjust the range.
- Quarterly Deployment Trend — a heatmap of deployments per day in the selected quarter. Each square is a day; teal intensity grows with volume. Use the quarter selector to switch between Q1–Q4.
- Deployment Outcomes — a gauge showing the total number of deployments for the period, broken down into Completed, Partial and Failed counts.
- Recent Activity — the most recent configuration events, each showing relative time, the actor and duration, the config file, and status. The card refreshes automatically and speeds up while queued or running activity is visible. Click View all to open the Activity Log.
Set the Configuration Files Deployed range before comparing volume across longer periods, then use the Quarterly Deployment Trend to see whether activity is clustered, steady or quiet within a quarter.