Dashboards
There are two types of dashboards in Fenergo SaaS.
The Task Dashboard gives you an overview of the tasks you own, details about the journeys you own tasks in, and your favorite tasks.
The Team Management Dashboard gives information about the total workload and output of each team. This dashboard contains team metrics, journey details, and a task queue for each team member.
When you log into Fenergo SaaS, your homepage will vary depending on what permissions you have been given:
| Team Management Dashboard Access | Task Dashboard Access | Homepage |
|---|---|---|
| Yes | Yes | Team Management Dashboard |
| Yes | No | Team Management Dashboard |
| No | Yes | Task Dashboard |
| No | No | User Profile Page |
Management Dashboard
The purpose of the Team Management Dashboard is to enable users to understand the workload and output of each of their teams. This dashboard is divided into 2 sections.
Team Stats
The graphs at the top of the page present information about how many journeys each team is starting and completing, how long they are taking, and how many tasks they are currently working on.
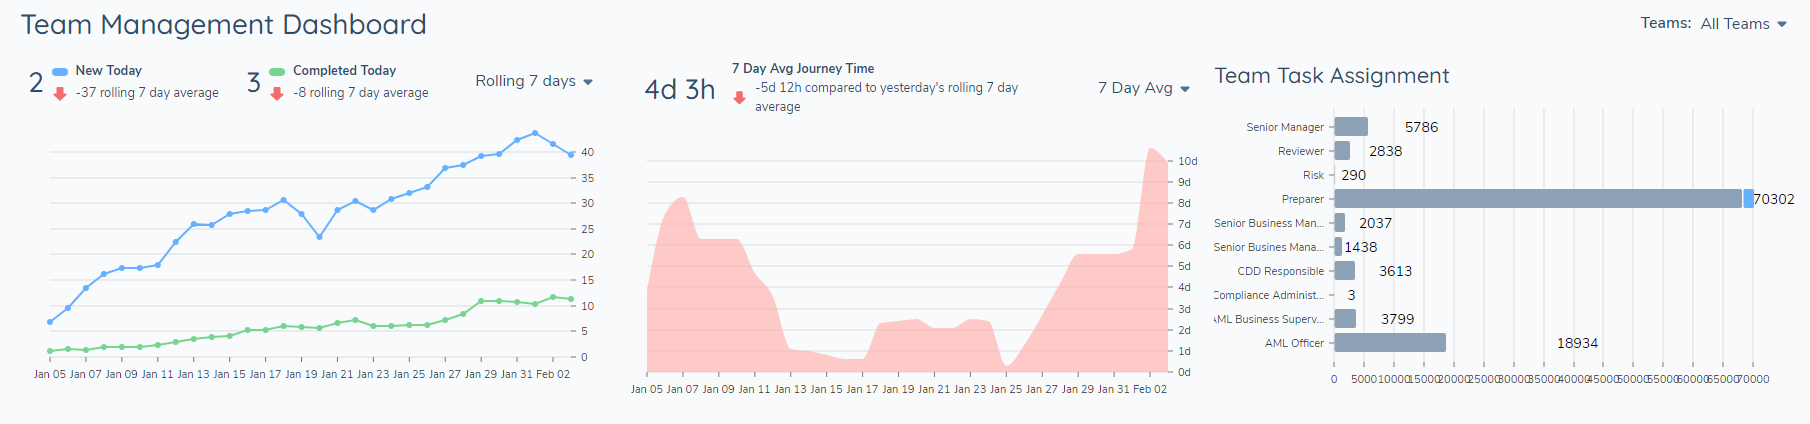
Each of these graphs can be filtered to reflect a subset of your teams.
Filters:
The filter on the top right allows you to select what teams you want reflected in the graphs.

This filter will only list the teams where you are a member. If nothing is selected, the graphs will show all data. If you select 1+ teams, the graphs will update to show the data from only those selected teams.
Note, it is independent of the Journey Overview on the bottom of the page: using the filter on the top right will only filter these graphs.
New/Completed Journeys
The New/Completed Journeys graph gives a summary of how many journeys a team is starting/completing over time.
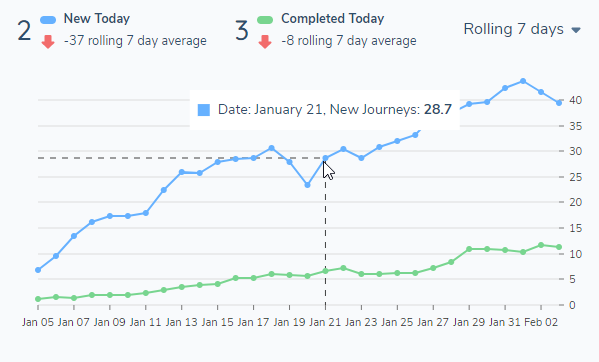
“ 2 New Today”: This number updates live to show the total number of journeys that commenced today where there are any tasks assigned to any of your selected teams.
“ 3 Completed Today”: This number updates live to show the total number of journeys that completed today where there were any tasks assigned to any of your selected teams.
Dropdown Filter:
- Daily: Graph will show the previous 14 days. Each point represents the journeys started/completed that day.
- Rolling 7 Day: Graph will show the past 30 days. Each point shows the rolling 7 day average of journeys started/completed. For example, the point “Date: January 2 1, New Journeys: 28.7” tells us that from January 14 – January 2 0, there were 28.7 journeys per day started on average.
- Rolling 30 Day: Graph will show the past 90 days. Each point shows the rolling 30 day average of journeys started/completed. For example, the point “Date: January 13, New Journeys: 17 ” tells us that from January 6 – December 12 , there were 17 journeys per day started on average.
“- 37 Rolling 7 Day Average”: This indicator compares the New Today number to the rolling x day average. This number is rounded to the closest whole number. For example, take this scenario:
- Today is February 3rd. There are 39 new journeys today.
- From January 28th to February 2nd, there were 37 new journeys every day on average.
- Our indicator tells us that this is - 37 rolling 7 day average. We now know that our team has started more journeys today than they have been on average over the past week.
Average Journey Time
This graph summarizes how many days and hours it takes on average for journeys to complete.
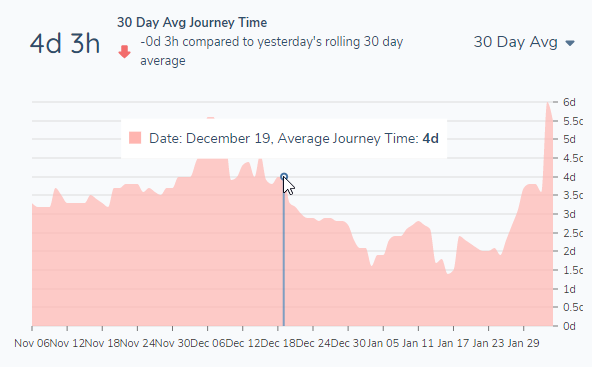
“ 4 d 3 h 30 Day Avg Journey Time”: Displays the average journey completion time for the current day; equivalent to the Today value when the Daily filter is applied.
“- 0 d 3 h rolling 30 day average”: Yesterday, the 30 day average was 4 d 0 h. Today it’s 4d 3 h. So compared to yesterday’s average, the team is spending 3h more on journeys today.
Dropdown Filter:
- Daily: Graph will show the previous 14 days. Each point represents the average journey time for journeys completed that day.
- 7 Day Avg: Graph will show the past 30 days. Each point shows the average journey time for journeys completed over the previous 7 days. For example, the point “Date: December 19, Average Journey Time: 4d” tells us that from December 12 – December 18 , journeys took on average 4 days to complete.
- 30 Day Avg: Graph will show the past 90 days. Each point shows the average journey time for journeys completed over the previous 30 days. For example, the point “Date: November 16 , Average Journey Time: 3 d 5 h” tells us that from November 9 – November 15 , journeys took on average 3 days and 5 hours to complete.
Team Task Assignment
This graph shows the tasks assigned to your teams that have not yet completed - any that have a status of “Not Started” or “In Progress”. These tasks are not filtered by access layers.
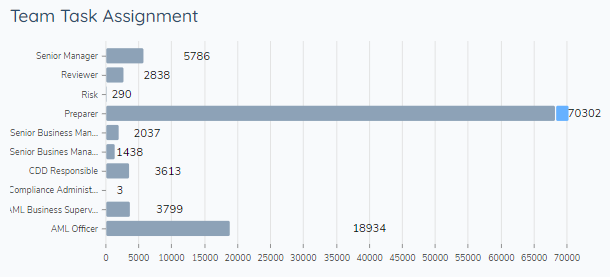
You will not see tasks that have been completed on this graph. You can hover over each bar to see a tooltip with more details about the assignment data.
If a team has no active journeys, the team will not appear on this graph. If a team has tasks in an active journey, but their team tasks are finished, they will appear on this graph with a total of 0 tasks assigned to them.
If tasks are reassigned/reopened, they will be reflected on this graph.
Journey View
The lower part of the page houses the journey view.
This graph displays all journeys that have tasks assigned to teams that the user is part of.
Filters:
The Journey View can be filtered by team, journey type and access layers.
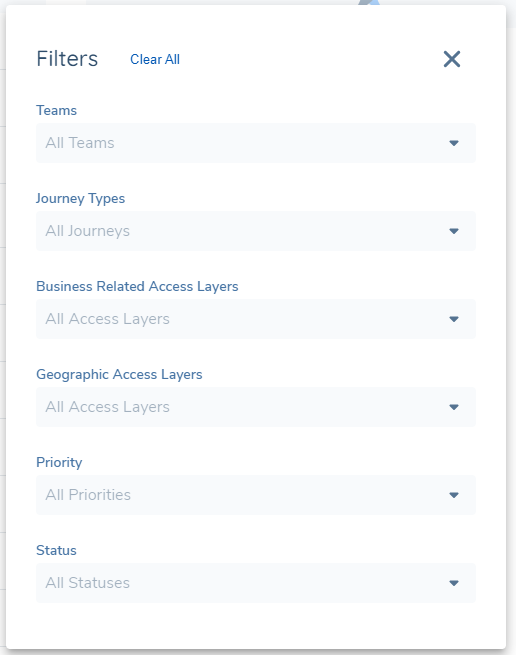
- Teams: Allows you to select which teams’ journeys you want to view
- Journey Types: Allows you to select which journey types you want to view
- Business Related Access Layer: Allows you to select which business related access layer’s journeys you want to view
- Geographic Access Layer: Allows you to select which geographic access layer’s journeys you want to view
- Priority: Allows you to select which journey priorities you want to view
The filters on the journey dashboard are independent of the stats graphs at the top of the page. When you use these filters, only the Journey View will be filtered.
Default Sorting
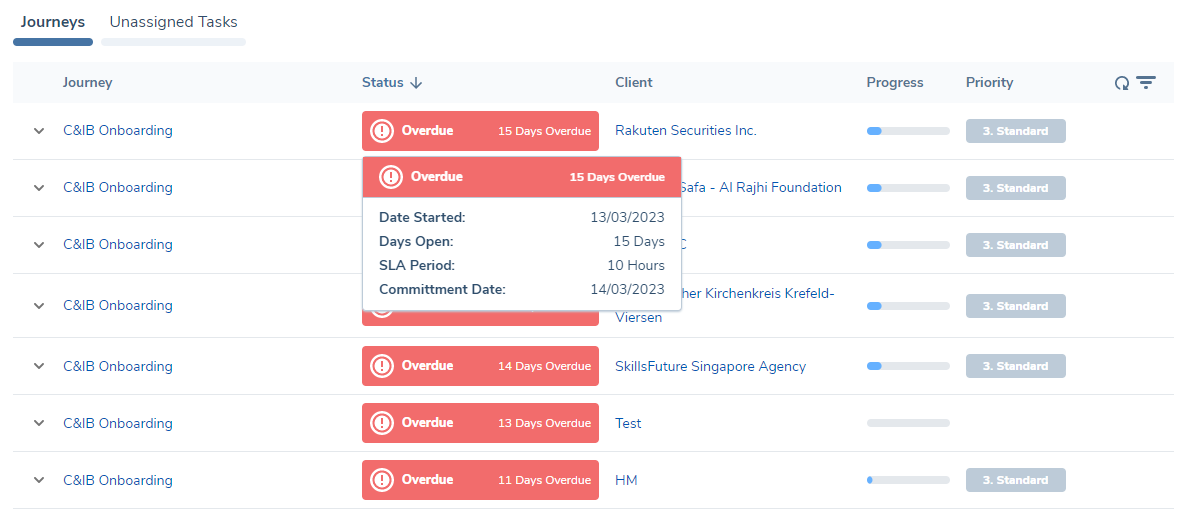
The default sorting on all Dashboards will be driven from the Status field - starting with the most Overdue items based on their defined SLA, working down towards the items that have the most time until they are Due. The reason for this is to help users identify their most urgent work. Users can still change the sorting on this column to the inverse if they wish or removing sorting on that column as well as sort on all other availbale columns in the Dashboard. The full order of items presented on Dashboards is:
- Overdue
- Approaching Due
- In Progress (with SLA)
- Paused
- In Progress (No SLA)
- Not Started
- Error
- Completed Overdue
- Descoped
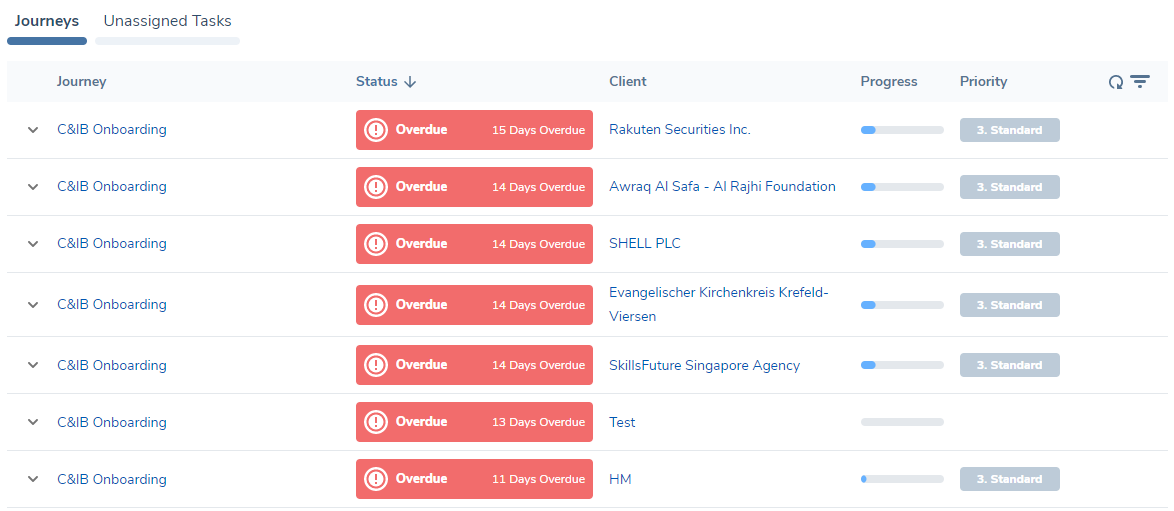
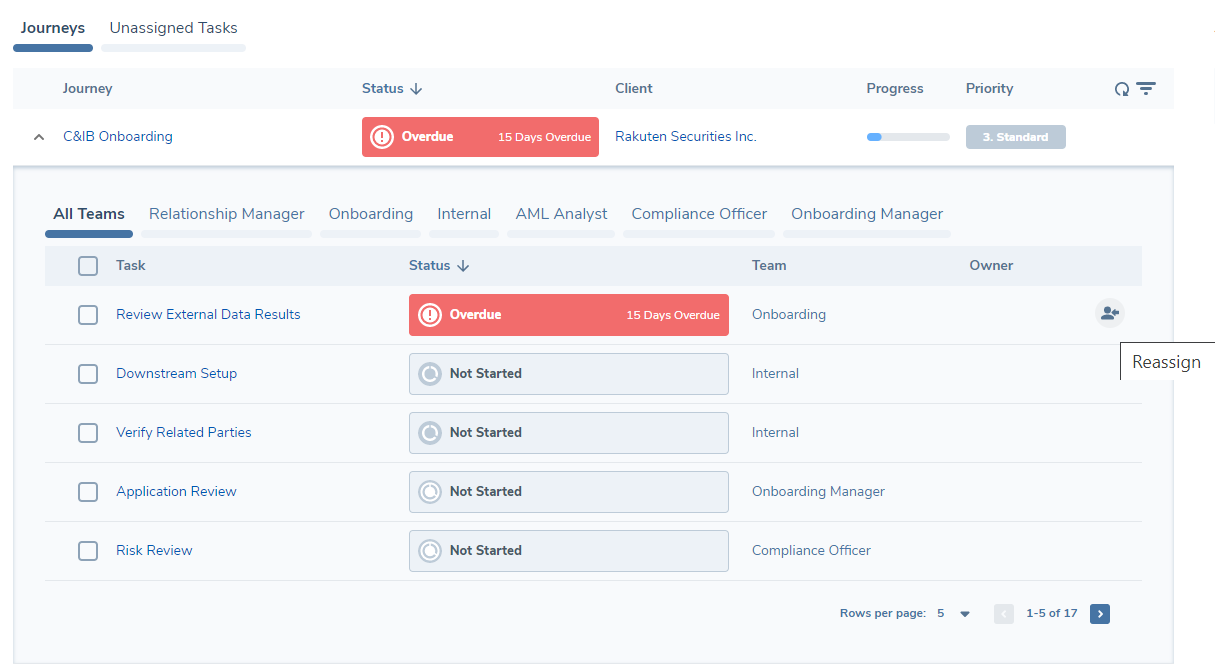
Journeys
The “Journeys” tab lists any journeys where your selected teams have been assigned tasks and has at least one in-progress task. If a journey is active, it will appear here even if your teams’ tasks are done.
This allows you to follow the progress of a journey to its completion.
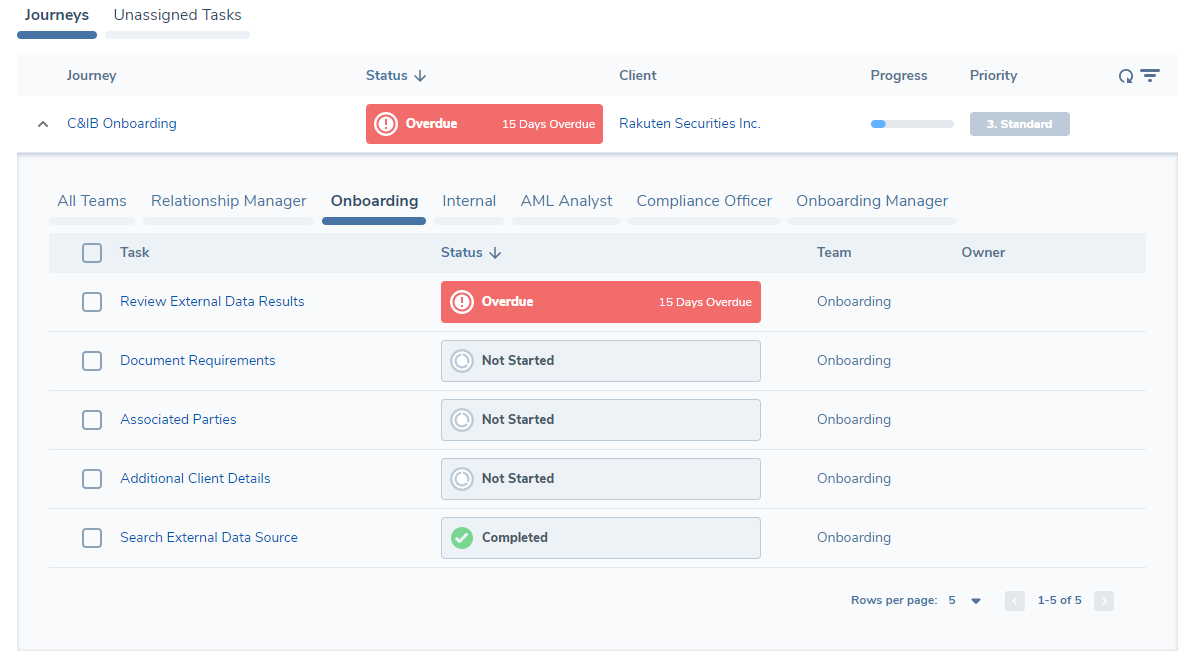
Each row of the journey dashboard shows:
- Journey type
- Client name
- Journey Status
- Journey progress indicator
- How many days the journey has been open
- Priority
Each of these headings can be clicked to sort the dashboard.
Each row expands to give a breakdown of the tasks that have been assigned to your teams.
- Each selected team has its own tab. Click a team name to see all the tasks assigned to that team.
- The final tab “All” shows all the tasks assigned to any of your selected teams.
From this expanded view you can see:
- Task name
- Task status
- Days open (Note this will be blank if the task is ‘Not Started’)
- Team it’s been assigned to
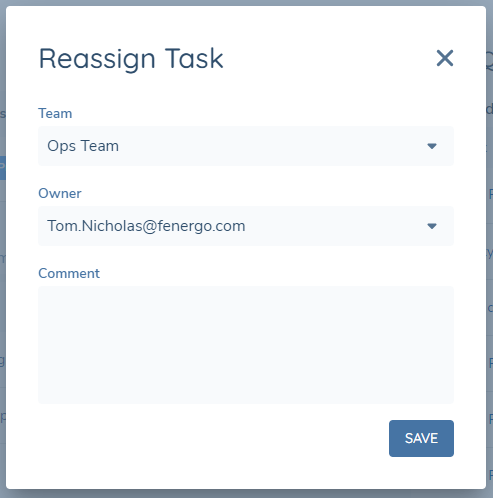
- Owner: reassign teams/owners by clicking the icon.
Unassigned Tasks
The Unassigned Task view displays every task that has been assigned to your selected teams but does not yet have a user assigned as the owner.
By default, Task Status filter is set to display "In Progress" tasks.
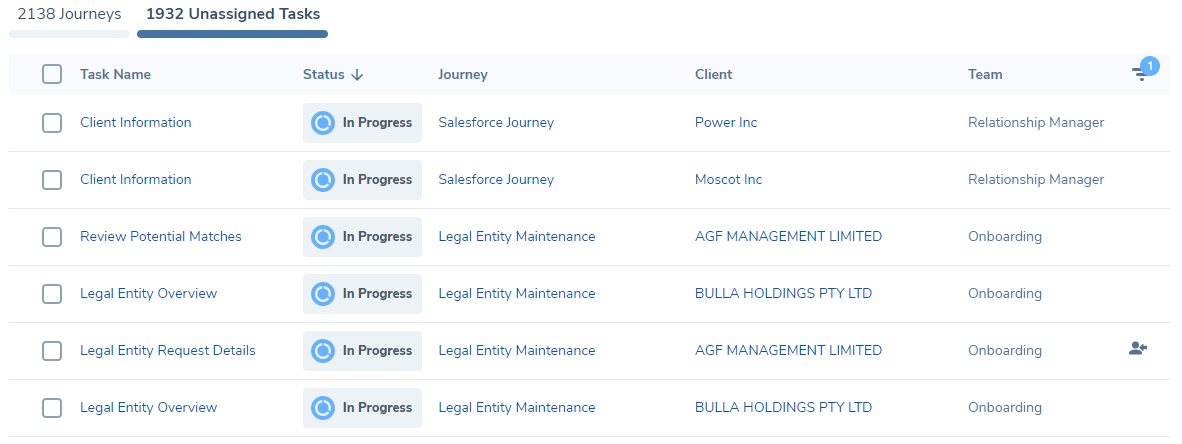
Tasks appear here when a journey is launched.
To assign an owner, click the assignment icon. This will open the assignment modal, where you can reassign it to a new team and select an owner. When a task is given to an owner, that user will get a notification and see the task in their own individual task dashboard - it will then disappear from this view.
Task Queue
The Task Queue allows you to select a user and see all the tasks they own. From this view, you can see the task name, status, the client's name, and how many days the task has been open.
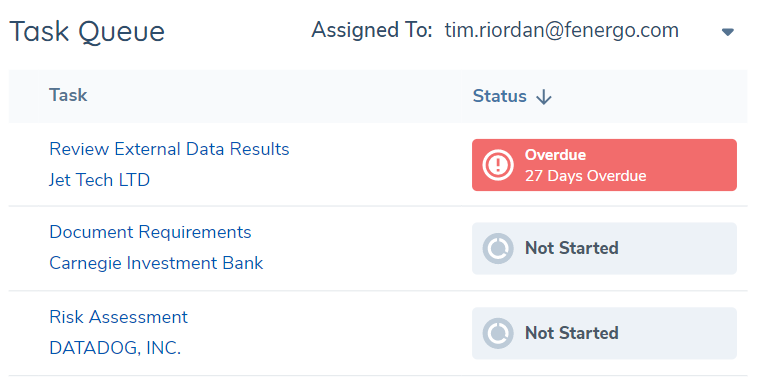
You can see one user at a time. To change your selection, click the “Assigned To” filter and select a username. You can only see the names of users that you share a team with.
Task Dashboard
The Task Dashboard gives you an overview of the tasks you own, details about the journeys where you own tasks, and your pinned tasks. Only tasks that your user owns are reflected in this dashboard, rather than all of those assigned to your team. If this dashboard is empty, it means that there are no tasks where you are an owner.
My Journeys
Any journeys where you own tasks will be displayed under the “Journeys” tab.
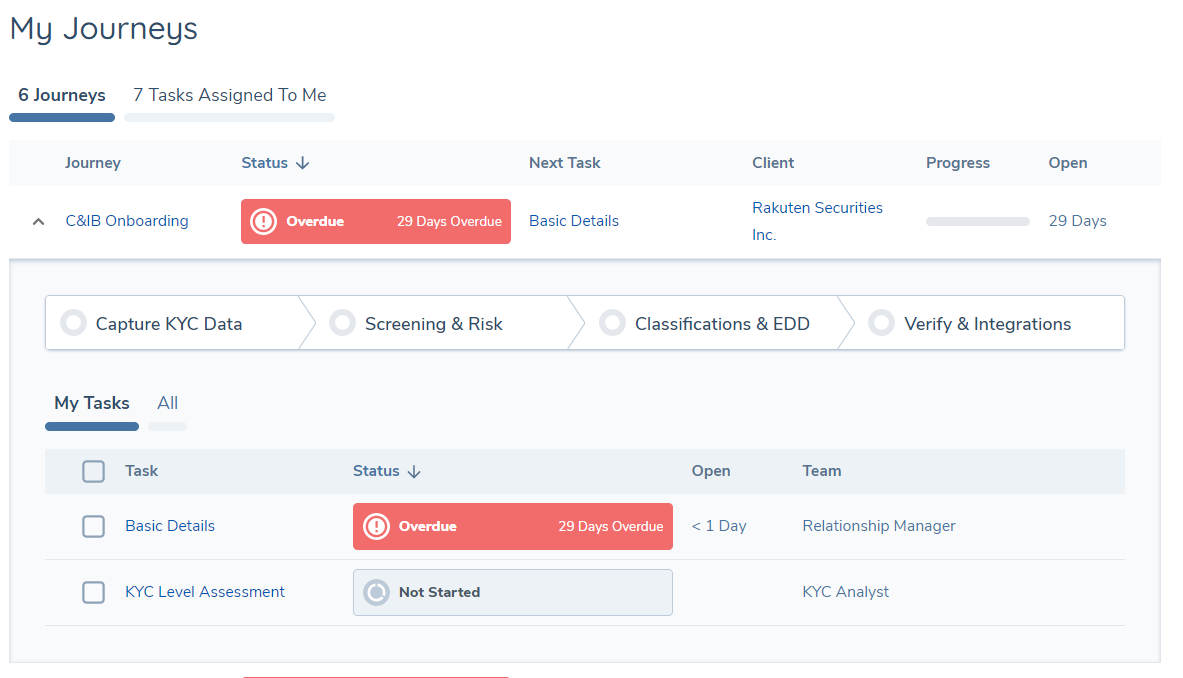
At the top level, you will see:
- Journey type: Click to navigate to the journey hub
- Client name: Click to navigate to the entity profile page
- Next Task: The next task in this journey that you own (and have not yet completed)
- The status of the journey
- The progress of the journey
- How many days the journey has been open
- Reassign the task: Click the reassignment icon to escalate tasks to other team members or assign tasks to another team entirely (see below)
- Pin the task (see below)
When you expand the row, you can see a detailed breakdown of all the tasks inside this journey.
- The “My Tasks” tab displays all the tasks you own
- The “All” tab displays every task in this journey and the status of each one, so that you can see the full context of the journey. This can be used to see if you’re being blocked, or if you are blocking someone else.
On the "My Journeys" tab, you will find a display of 250 journeys arranged in descending order based on the number of days they have been open.
Tasks Assigned to Me
The “Tasks Assigned to Me” tab lists all the tasks you own that are not yet complete.
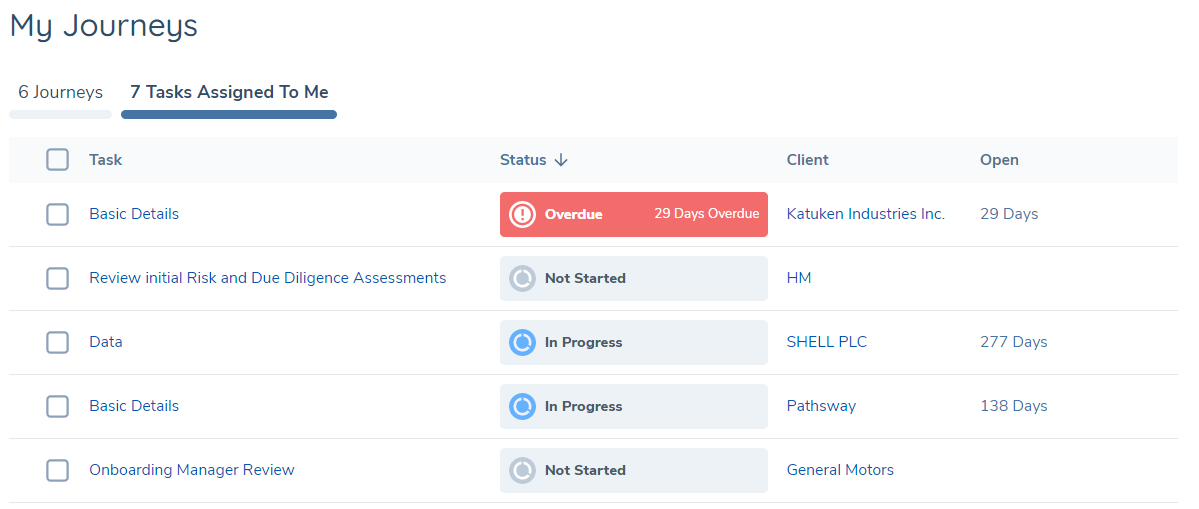
Here, you can see:
- Task name: click to navigate directly to the task
- Task status
- Client name: click to navigate to the entity’s profile page.
- Days Open: How many days the task has been “In Progress”
- Reassign the task: Click the reassignment icon to escalate tasks to other team members or assign tasks to another team entirely (see below)
- Pin the task (see below)
On the "Tasks Assigned to Me" tab, you can view 5000 tasks sorted in descending order based on the number of days they have been open.
Pinned Tasks
The “Pinned Tasks” panel allows you quick access to tasks that you wish to track.
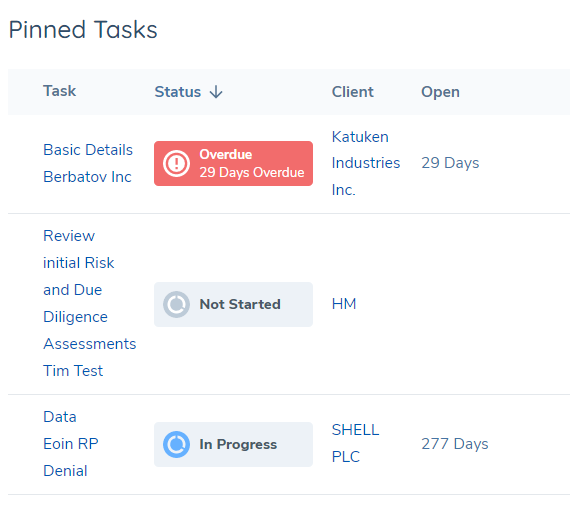
You can pin a task by clicking the pin icon. Unpin tasks by clicking the pin icon again. When a task completes, it will automatically be removed from this view. The icon represents the state the task is in: a solid pin means it’s pinned, an opaque pin means it’s not pinned.
Task Assignment
From both the management dashboard and the tasks dashboard the user can assign or re-assign tasks to a specific team or user.
You can assign or re-assign a task by clicking the reassign icon. This action will open a panel where you can select the team, the owner and leave a comment for the assigned user. If you leave a comment, the assigned user will get a notification with a link to the task.