Observability Dashboard
Overview
The Observability dashboard allows Transaction Monitoring users to monitor the health of transaction ingestion and rule execution from a single page. It shows the volume and outcome of transactions and scheduled rule runs over a time range that you select.
The content of the dashboard depends on how your tenant ingests data:
- Real-time tenants see a Transaction Summary tab and a Rule Executions tab.
- Batch tenants see a Batch Transactions tab and a Rule Executions tab.
The variant shown is determined automatically by your tenant's ingestion mode. It is not a setting you change on the page.
Data displayed on the dashboard is retained for 30 days. Activity outside this window is not available.
Accessing the dashboard
Users require the Observability Access permission to open the Observability dashboard. Without this permission the dashboard is not available.
Selecting a time range
Each tab provides From and To date inputs. Use these to set the reporting period. All metrics, charts and detail tables on the tab update to reflect the selected range, within the 30-day retention limit.
Transaction Summary (Real-time tenants)
The Transaction Summary tab reports on real-time transaction ingestion volume, success rates and failure detail for the selected time range.
Transaction metrics
The tab displays the following summary figures:
- Total – the total number of transactions ingested
- Succeeded – the number of transactions ingested successfully
- Failed – the number of transactions that failed
- Success Rate – the percentage of ingested transactions that succeeded
Ingestion over time
The Ingestion over time chart plots succeeded and failed transactions per day across the selected range. The chart can be exported using the PNG and SVG options, and the Reset option returns the chart to its default view.
Ingestion details
The Ingestion Details table lists each date in the selected range with the number of transactions that Succeeded and Failed on that date.
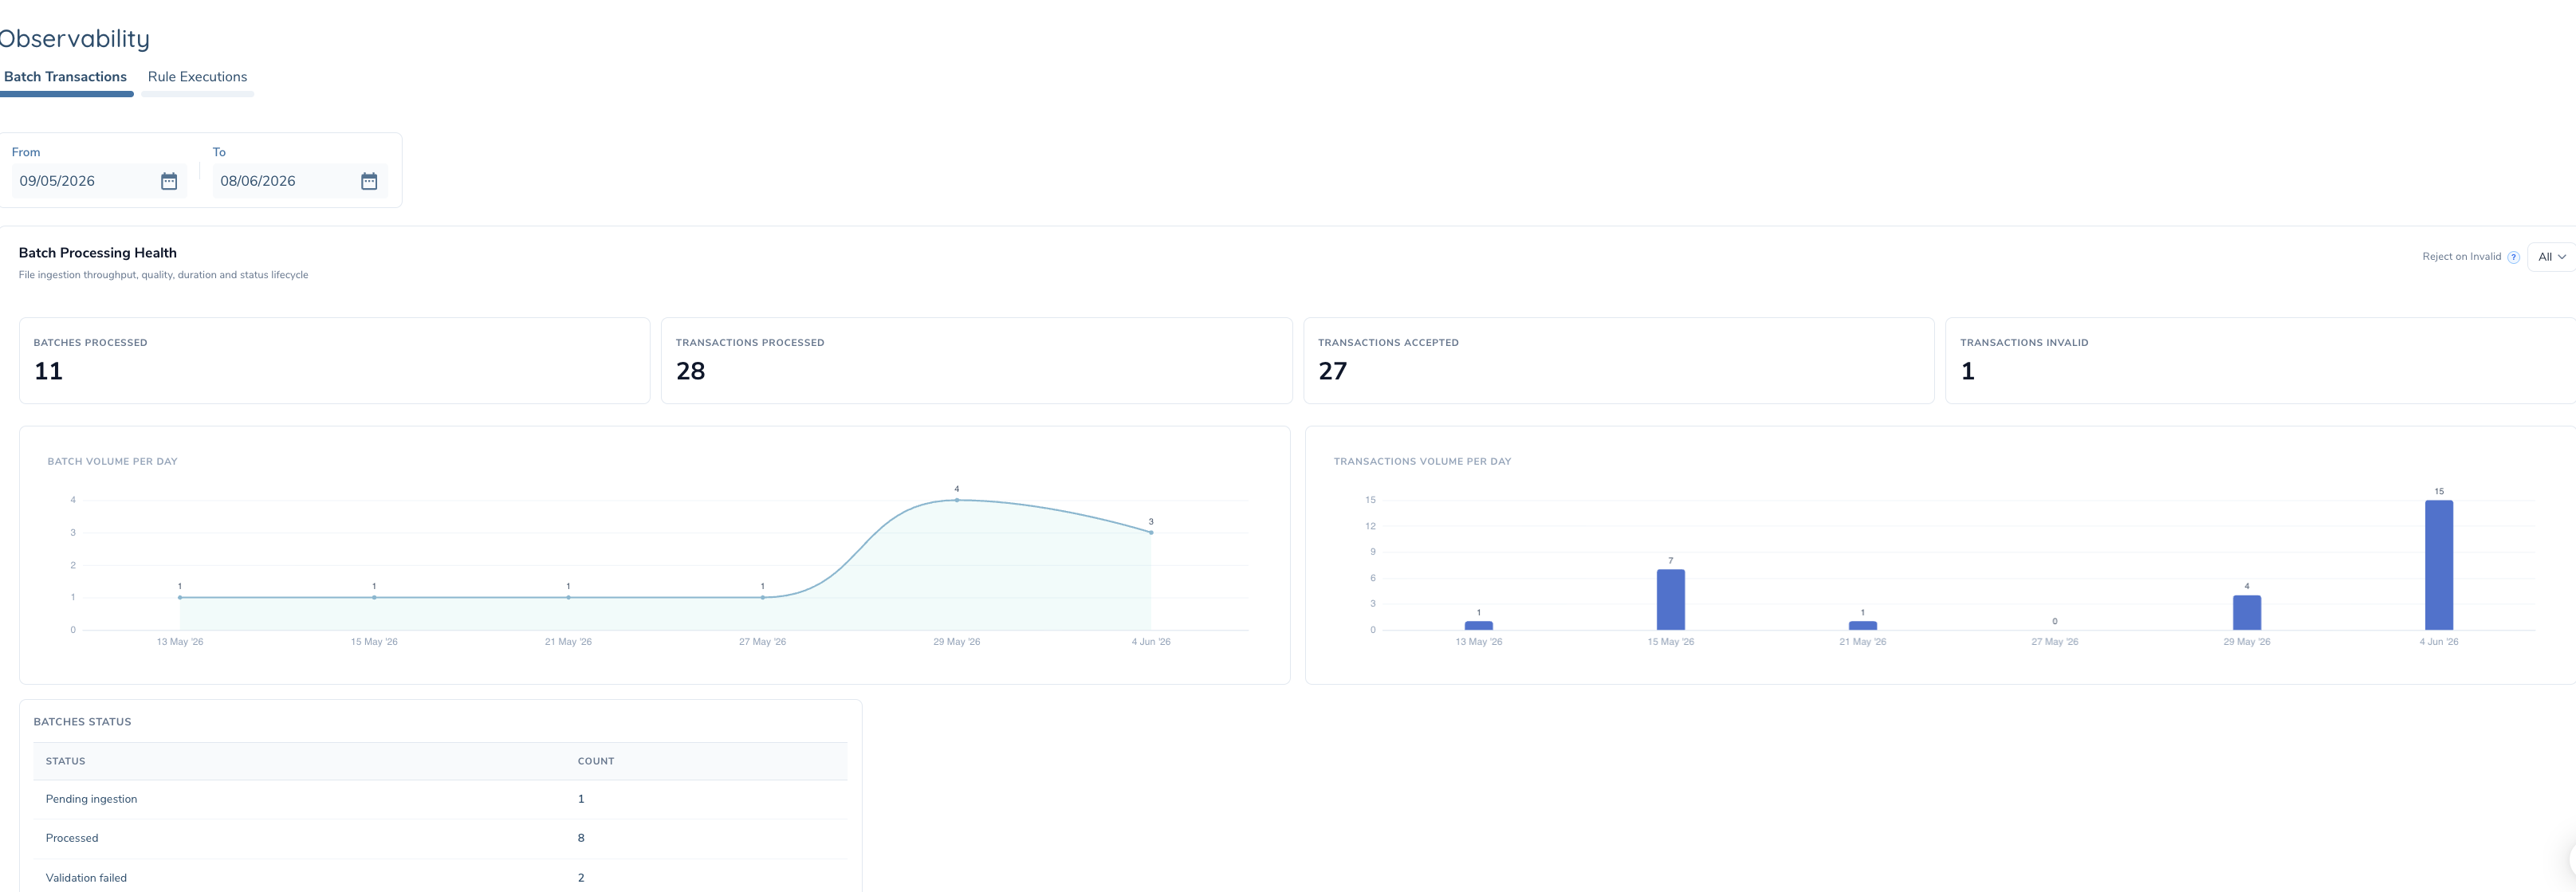
Batch Transactions (Batch tenants)
The Batch Transactions tab reports on batch processing health, covering file ingestion throughput, quality, duration and status lifecycle for the selected time range.
Reject on Invalid filter
The Reject on Invalid filter indicates whether a batch should be rejected if any source line within it is invalid. The filter has three options:
- Yes – show batches configured to be rejected when any source line is invalid
- No – show batches not configured to be rejected on an invalid source line
- All – show all batches regardless of this setting
Batch metrics
The tab displays the following summary figures:
- Batches Processed – the number of batches processed
- Transactions Processed – the number of transactions processed across those batches
- Transactions Accepted – the number of processed transactions that were accepted
- Transactions Invalid – the number of processed transactions found to be invalid
Volume charts
Two charts show volume across the selected range:
- Batch volume per day – the number of batches processed per day
- Transactions volume per day – the number of transactions processed per day
Batch status
The Batches Status table lists each batch status and the count of batches in that status, for example Pending ingestion, Processed and Validation failed.
Rule Executions (All tenants)
The Rule Executions tab reports on scheduled rule execution outcomes, alert volumes and failure tracking for the selected time range. It is available to both real-time and batch tenants.
Rule execution metrics
The tab displays the following summary figures:
- Total Executions – the total number of rule executions
- Succeeded – the number of executions that completed successfully
- Failed – the number of executions that failed
- Unique Rules – the number of distinct rules executed
Executions over time
The Executions over time chart plots succeeded and failed rule executions per day across the selected range.
Rule execution details
The Rule Execution Details section lists executions grouped by date. Each date can be expanded to show the number of rules run on that date and how many succeeded.
Permissions
- Observability Access: Allows users to open and view the Observability dashboard, including the tabs available for the tenant's ingestion mode.